MARVIS: Combining Mobile Devices and Augmented Reality for Visual Data Analysis
Overview
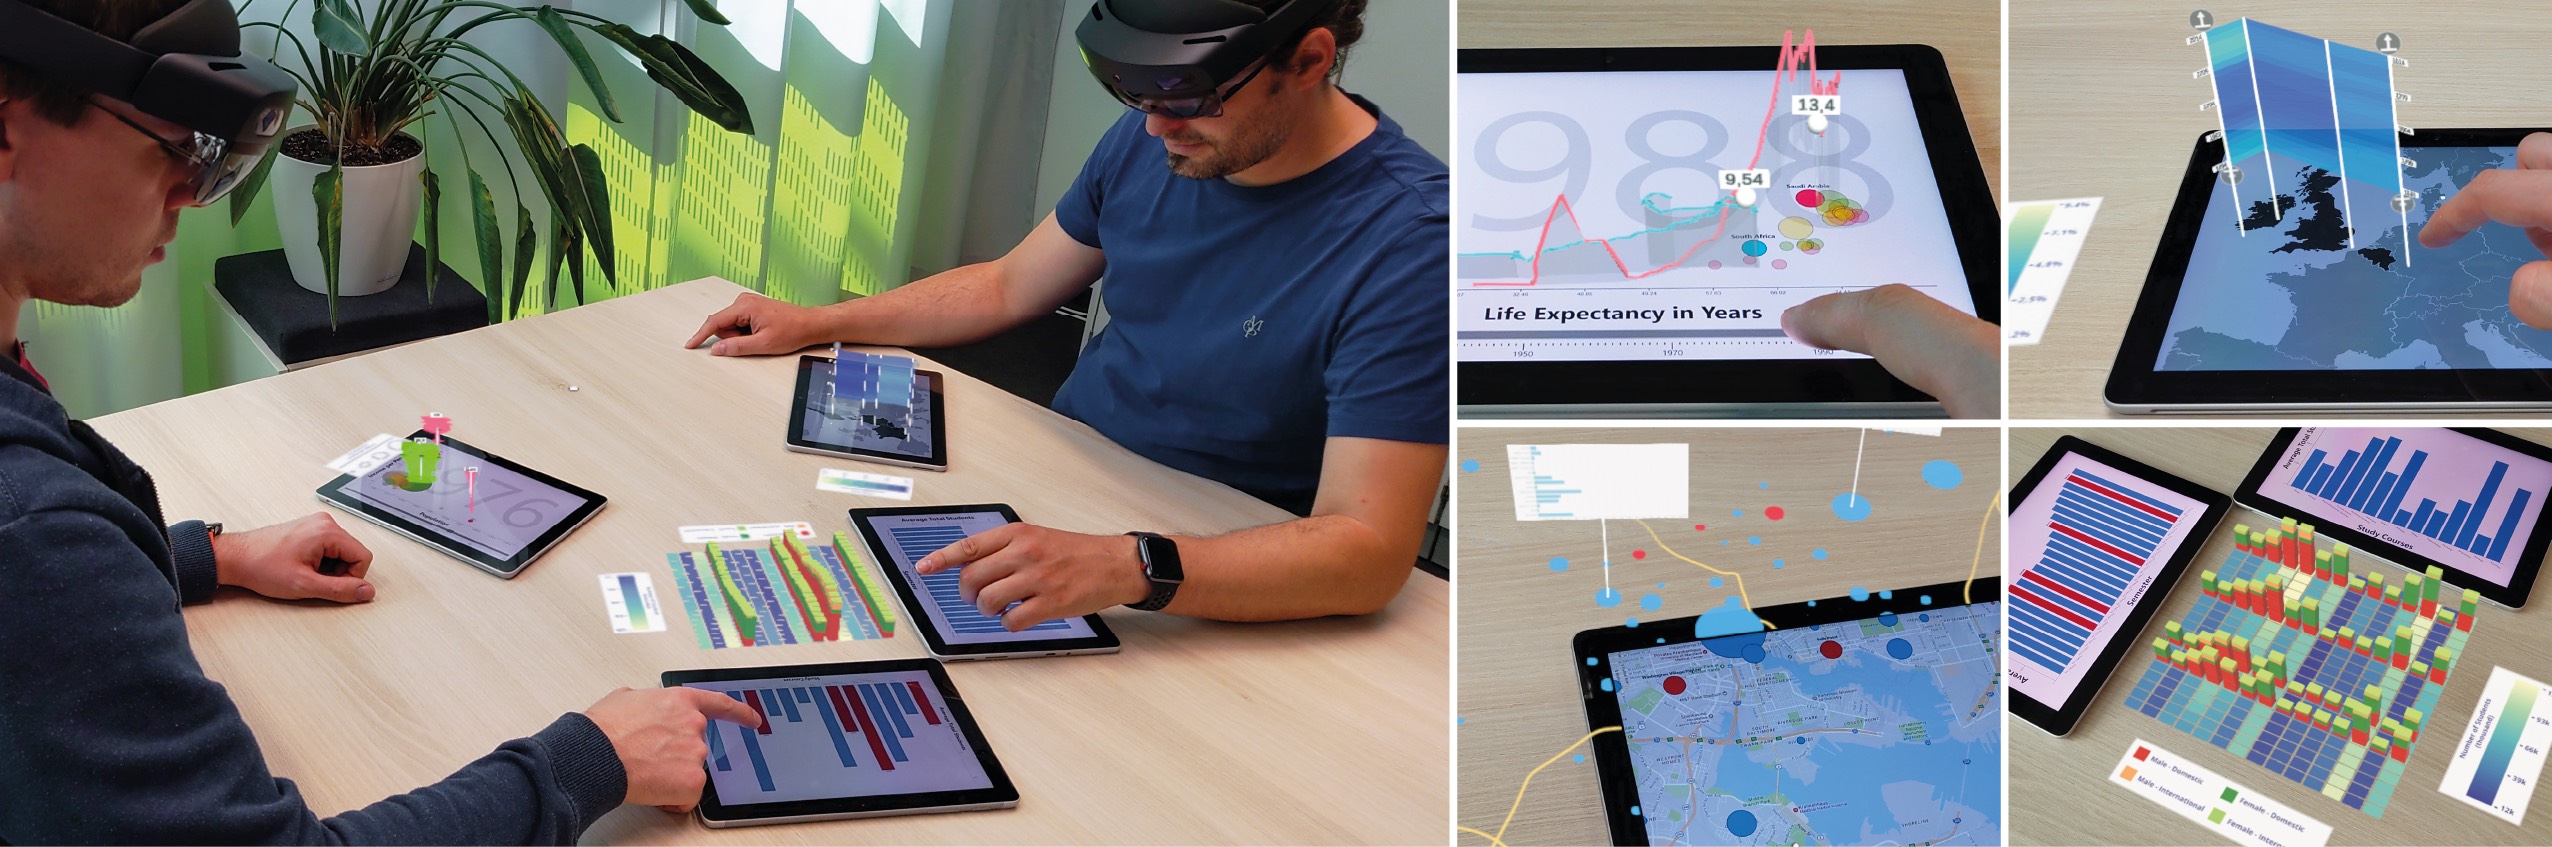
MARVIS is a conceptual framework that integrates mobile devices (i.e., tablets) with head-mounted Augmented Reality (AR) systems to enhance visual data analysis.
By leveraging the strengths of both technologies — mobile devices’ tangibility and precision input, and AR’s flexible, immersive display space — MARVIS addresses the limitations of small screens and supports complex analytical tasks.
The framework extends mobile visualizations with AR elements, enabling seamless interactions, cross-device linking, and 3D data exploration.
Visualization and Interaction Concepts
In our work, we describe exemplary techniques as part of several new visualization and interaction concepts.
The techniques build on visualization principles and tasks, including overview+detail, linking and brushing, data filtering, and visual comparison.
Also, MARVIS allows for adapting and enhancing existing visualization techniques.
The concepts can be organized into two categories: single mobile device with AR and two or more mobile devices with AR.
Note that information shown in AR is colored in purple, that of mobile devices in blue.
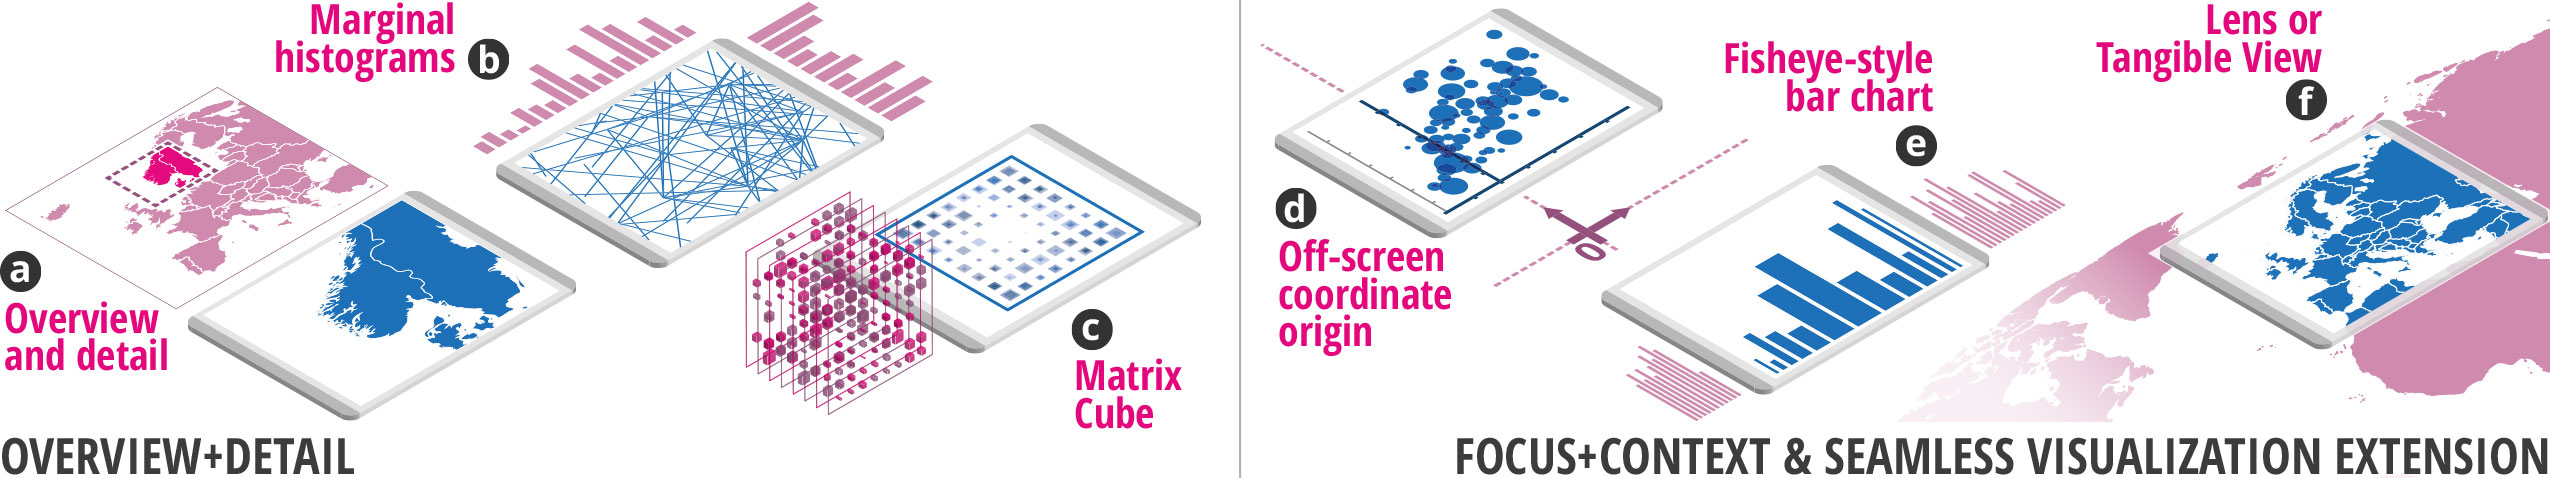
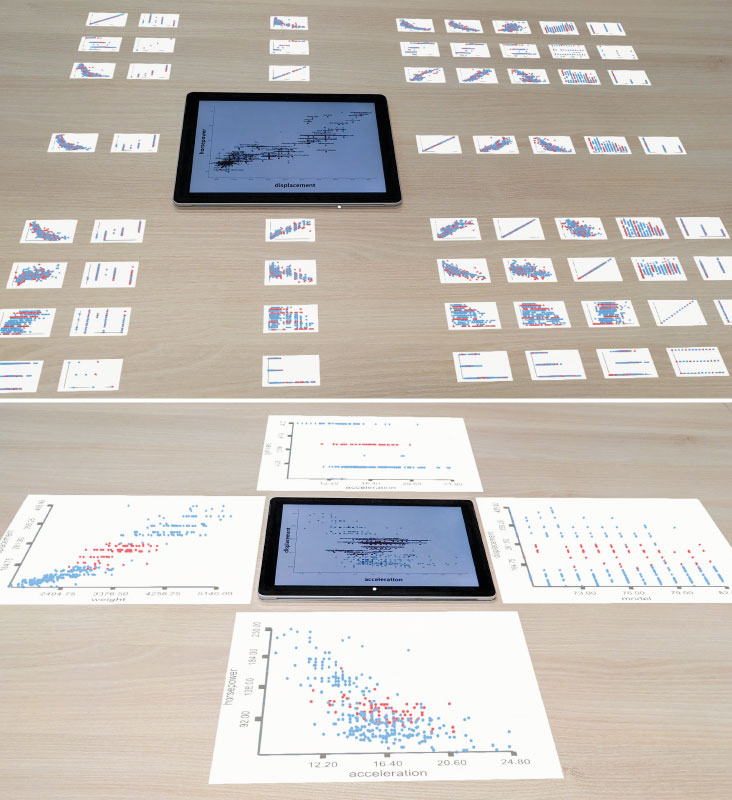
Using AR for adapting different Overview+Detail and Focus+Context techniques. (a) A typical map overview; (b) Marginal histograms around the mobile device; (c) 3D visualization of a Matrix Cube; (d) Navigation support by an off-screen coordinate origin; (e) Zoomed in bar chart with fisheye-style continuation; (f) Mobile device as a detailed lens into a larger map;
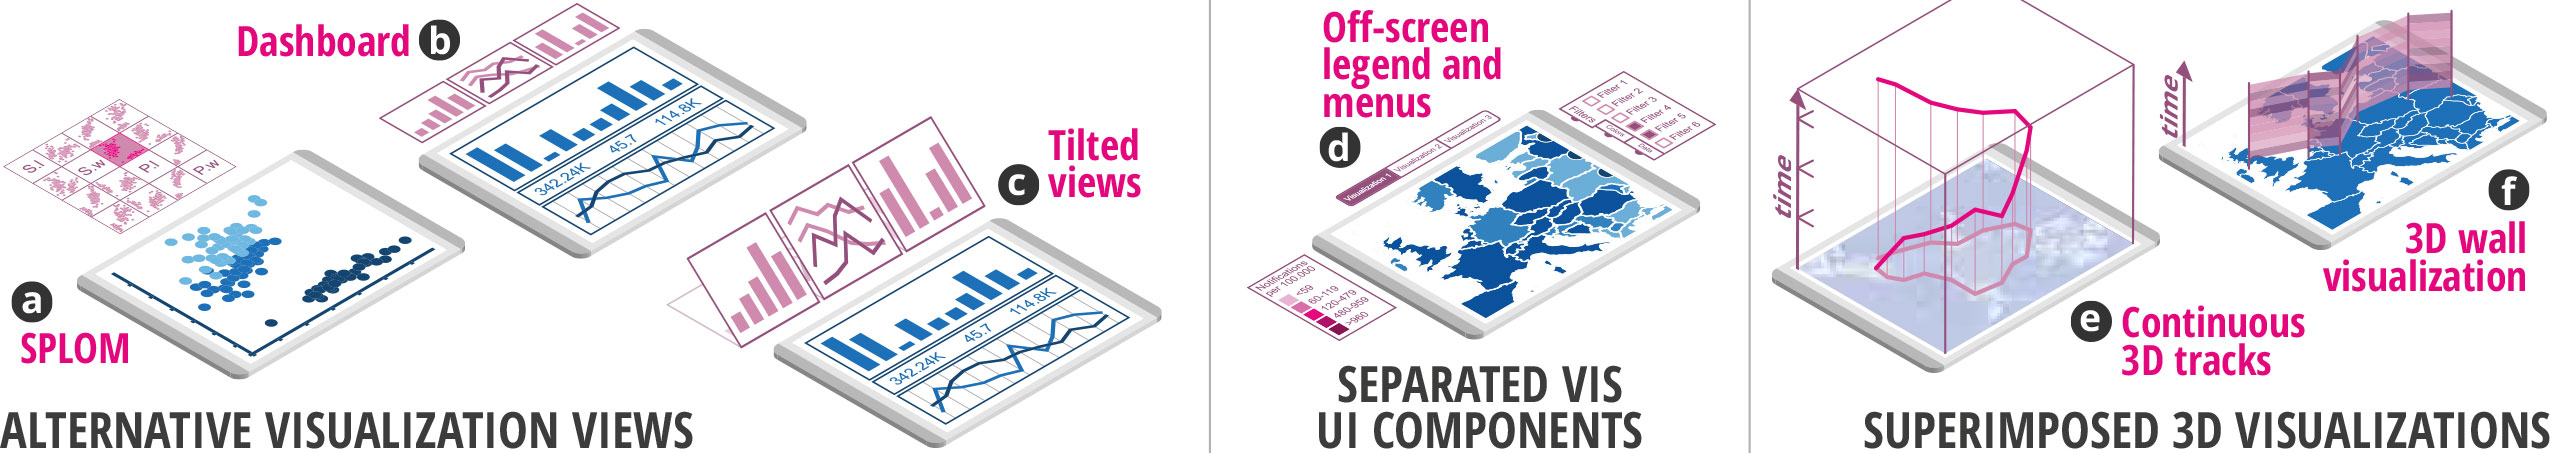
Using AR for Alternative Visualization Views, Separated Visualization User Interface Components, and Superimposed 3D Visualizations. (a) SPLOM shows alternative scatterplots configurations; (b) Distributed views of a dashboard; (c) Tilted AR views; (d) Off-loaded legend and menus; (e) Continuous 3D track above a map; (f) 3D wall visualization aligned to a map;
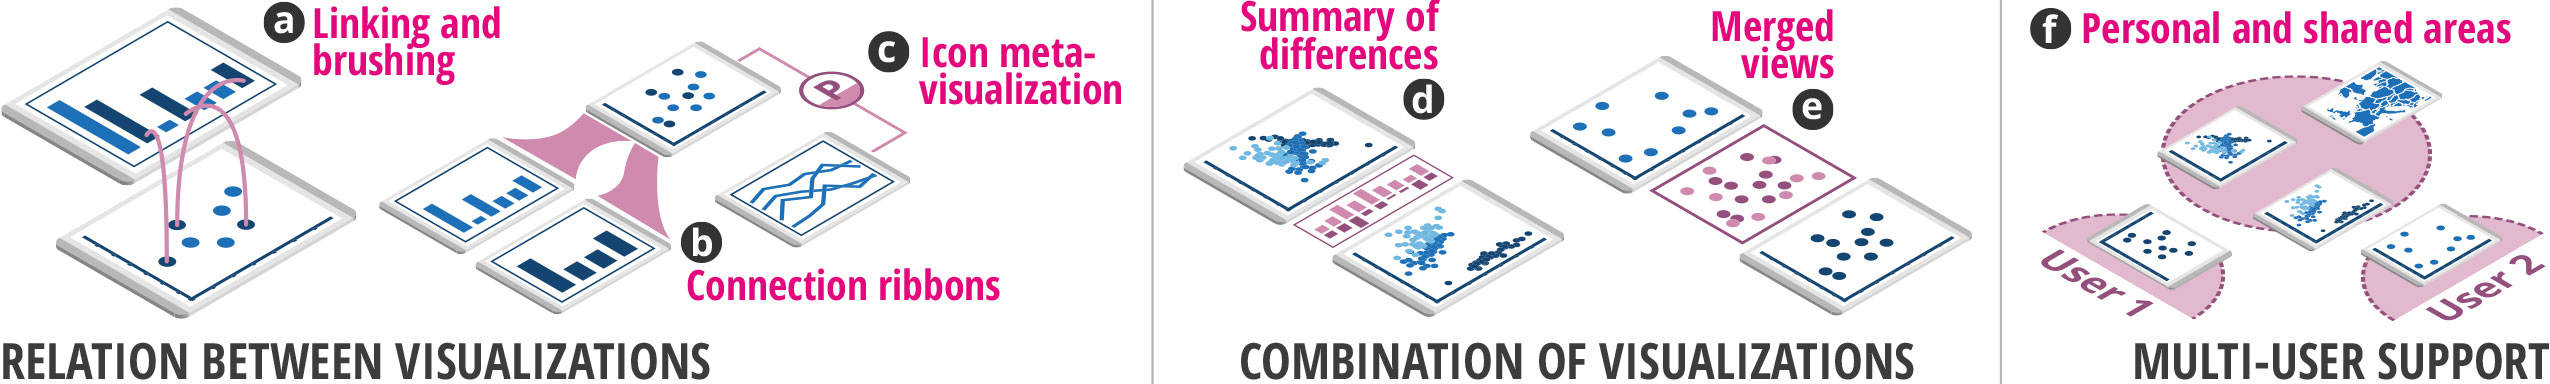
Using AR for Relations Between Visualizations, Combination of
Visualizations, and Multi-User Support. (a) Linking and brushing supported by curved AR connections; (b) Ribbons between devices indicate the relative proportions; (c) Icon meta-visualizations reveal view relations; (d) AR bar chart summarizes calculated differences between views; (e) Merging two views in AR; (f) Personal and shared areas for collaborative activities;
Prototype Application: Implemented Example Use Cases
Our prototype application consists of six implemented example use cases and exemplifies how our proposed concepts can be realized. Each example demonstrates parts of our concepts, but also extends and enhances already existing visualization techniques.
Scatterplot Matrix Navigation
AR is used to show a SPLOM around the mobile device. The tablet shows a detailed view of one specific cell corresponding to its position in the matrix. Alternatively, only the four neighboring cells are visible in AR, but in a tablet-sized scale.
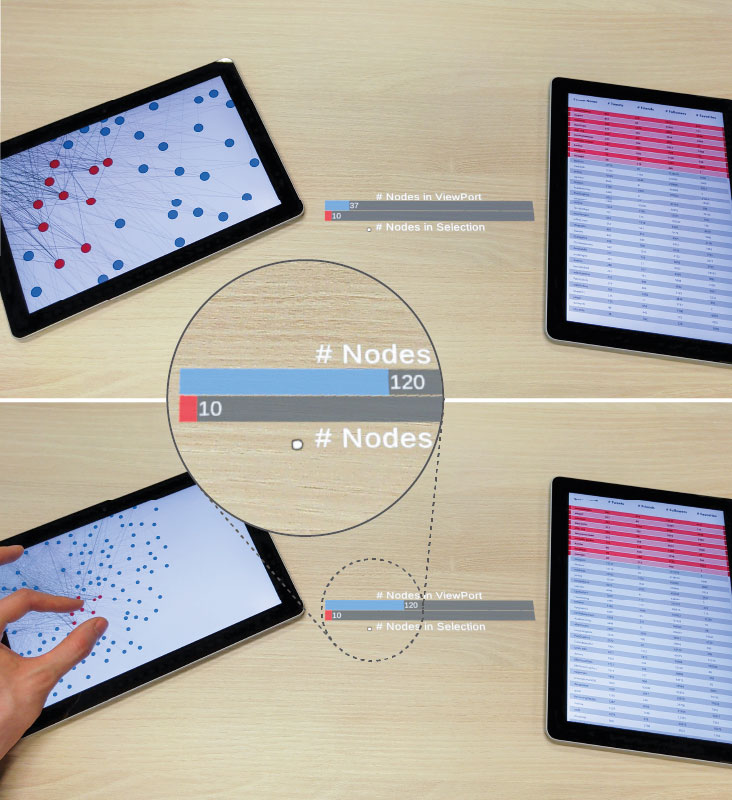
Node-Link Diagram and Attribute Visualization
AR link between two views/devices. The link shows additional information about the device connection, in this case the number of selected and filtered nodes.
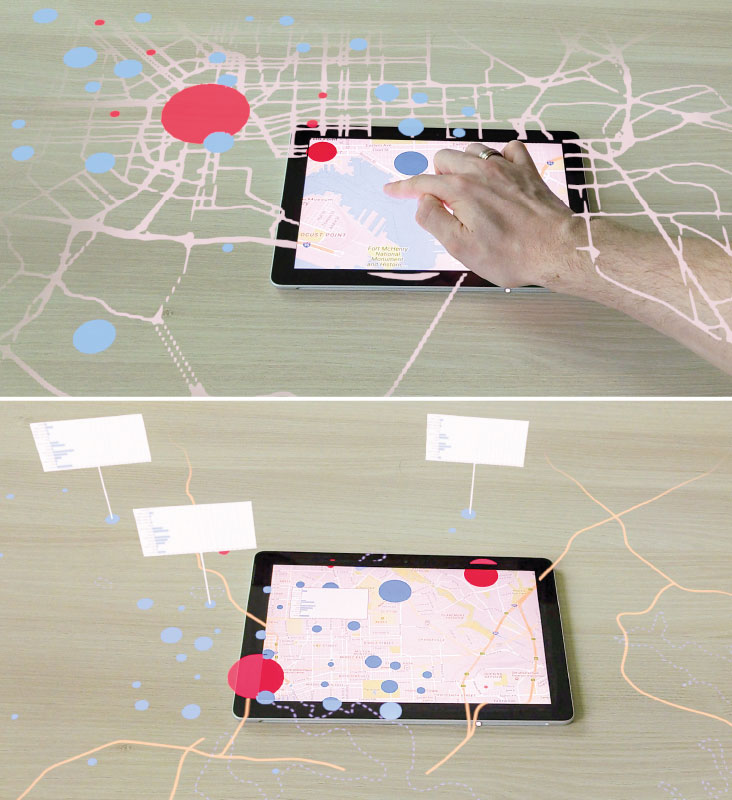
Map Navigation
AR is used to continue the map using less details (street-layer and data items) or a more abstract visual style (highways, bodies of water, and data items). Also illustrates details-on-demand on both the mobile device and in AR.
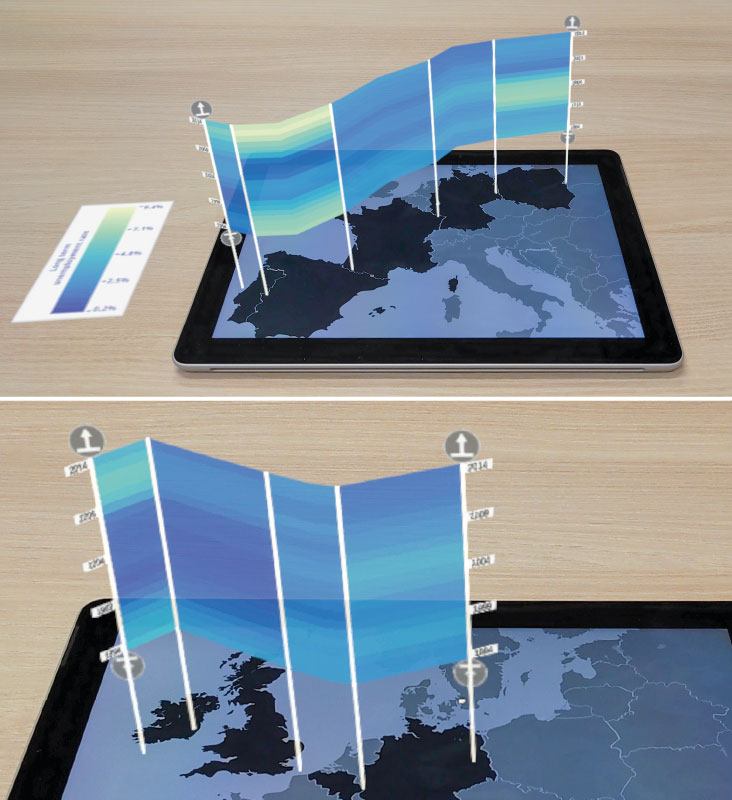
Non-Planar Slices on a Map
Adaptation of the technique Great Wall of Space-Time (by Tominski & Schulz, 2012). The wall in AR details unemployment data per selected country over time (from the bottom to top).
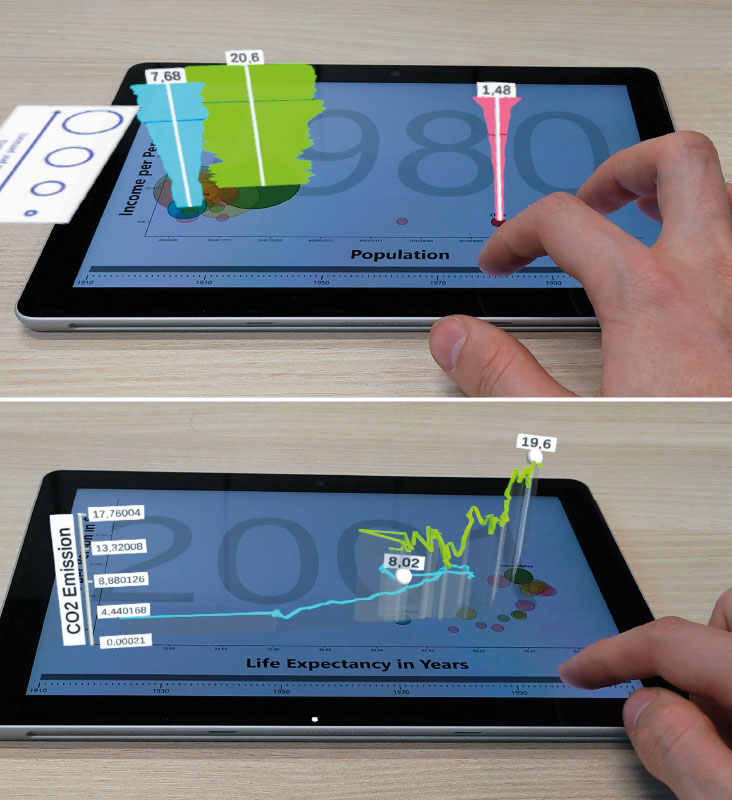
Scatterplot with 3D Glyphs and Trajectories
Scatterplot extended with 3D glyphs and another scatterplot superimposed with 3D trajectories. These examples illustrate how existing interfaces (in this case inspired by the Gapminder bubble plots) can be extended.
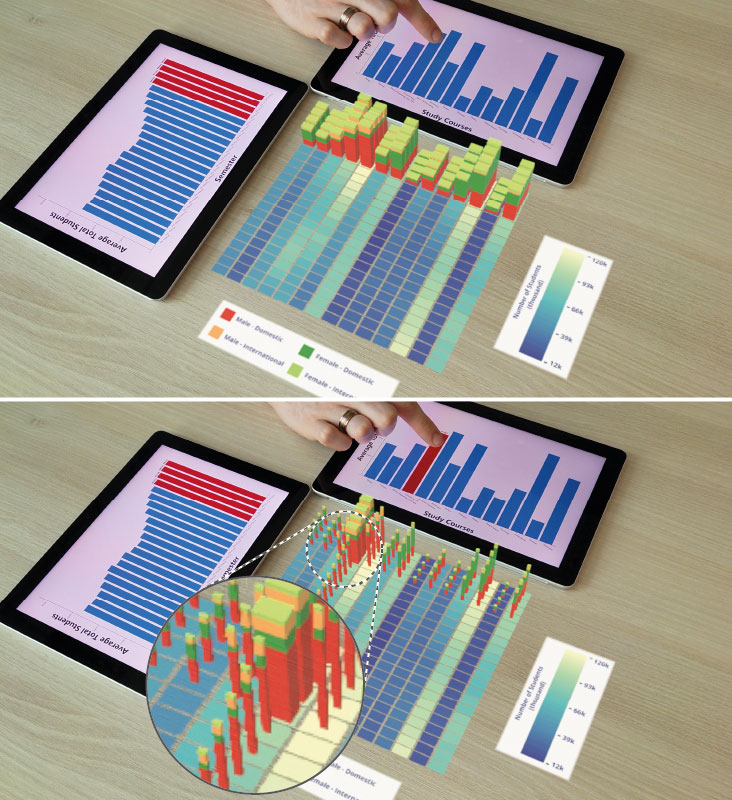
Combined Bar Charts with Heatmap and 3D Stacked Bars
AR heatmap and stacked bars resulting from a combination of visualizations and devices. Since rows and columns are selected (bottom), individual cells and stacked bars at the intersection are highlighted.